- Published on
Announcing Tails
- Authors

- Name
- Jacob Aronoff
What's the problem?
Say you're looking at some metrics in Grafana but the labels look all wrong. You expected to see something like pod but instead you're seeing kube_pod. Maybe the k8sattribute processor you wanted to use to enrich all of your traces isn't working. It could be a log whose body isn't being extracting correctly.
These are the biggest problems I've had when using the otel collector:
- resource attribute enrichment working
- attribute naming conventions
- is data being processed at all?
What can we do about it?
The otel collector ecosystem is vast and full of possibilities. Thanks to the work of the OpAMP-SIG and Antoine Toulme, we're able to solve all of these problems! By utilizing the Remote Tap Processor and the OpAMP Extension we can hook into a live collector and see what's going on in there.
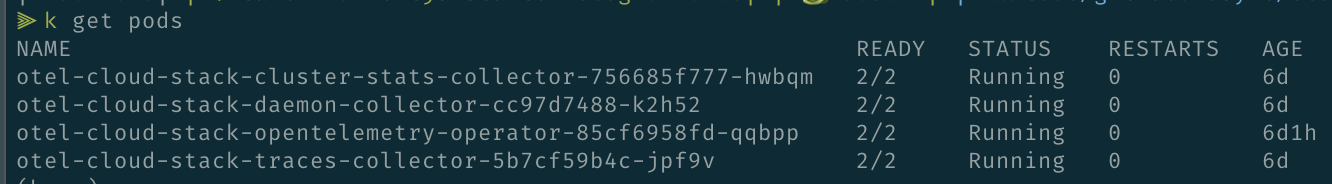
I call the tool "tails" because the goal is to tail a collector and find exactly what you're looking for. The UI allows you to view the live configuration of the collector (if you have the opamp extension configured). You can also connect to the collector's remote tap processor to view the live telemetry. It's run as a docker container which is released here. You can run this like so in a Kubernetes cluster:
Collector config:
---
extensions:
  opamp:
    server:
      ws:
        endpoint: ws://127.0.0.1:4000/v1/opamp
        tls:
          insecure: true
---
processors:
  remotetap:
    endpoint: localhost:12001
---
service:
  pipelines:
    traces:
      receivers: [otlp]
      processors: [remotetap, batch]
      exporters: [debug]

    metrics:
      receivers: [otlp]
      processors: [remotetap, batch]
      exporters: [debug]

    logs:
      receivers: [otlp]
      processors: [remotetap, batch]
      exporters: [debug]

  extensions: [opamp]
Add this in either a collector CRD of helm chart:
additionalContainers:
  - name: tails
    image: ghcr.io/jaronoff97/tails:v0.0.6
    ports:
      - containerPort: 4000
    env:
      - name: SECRET_KEY_BASE
        value: <add a 64 byte length secret>
and apply the change!
You'll see your pod has a new container that you can port-forward to: k port-forward pod/<pod-name> -p 4000:4000. Once you're port-forwarding, open up http://localhost:4000 and you'll be greeted with the tails UI. Start your remote tap, and navigate to your desired telemetry type. From here, you can filter attributes, resource attributes, and view raw data. You can view a quick demo here:
Please give it a try and let me know your thoughts! Feel free to open an issue here or find me in the CNCF Slack!